Navi Mumbai Industrial Rental Yield by Belt: TTC, Taloja, Kalamboli, Panvel and Dronagiri
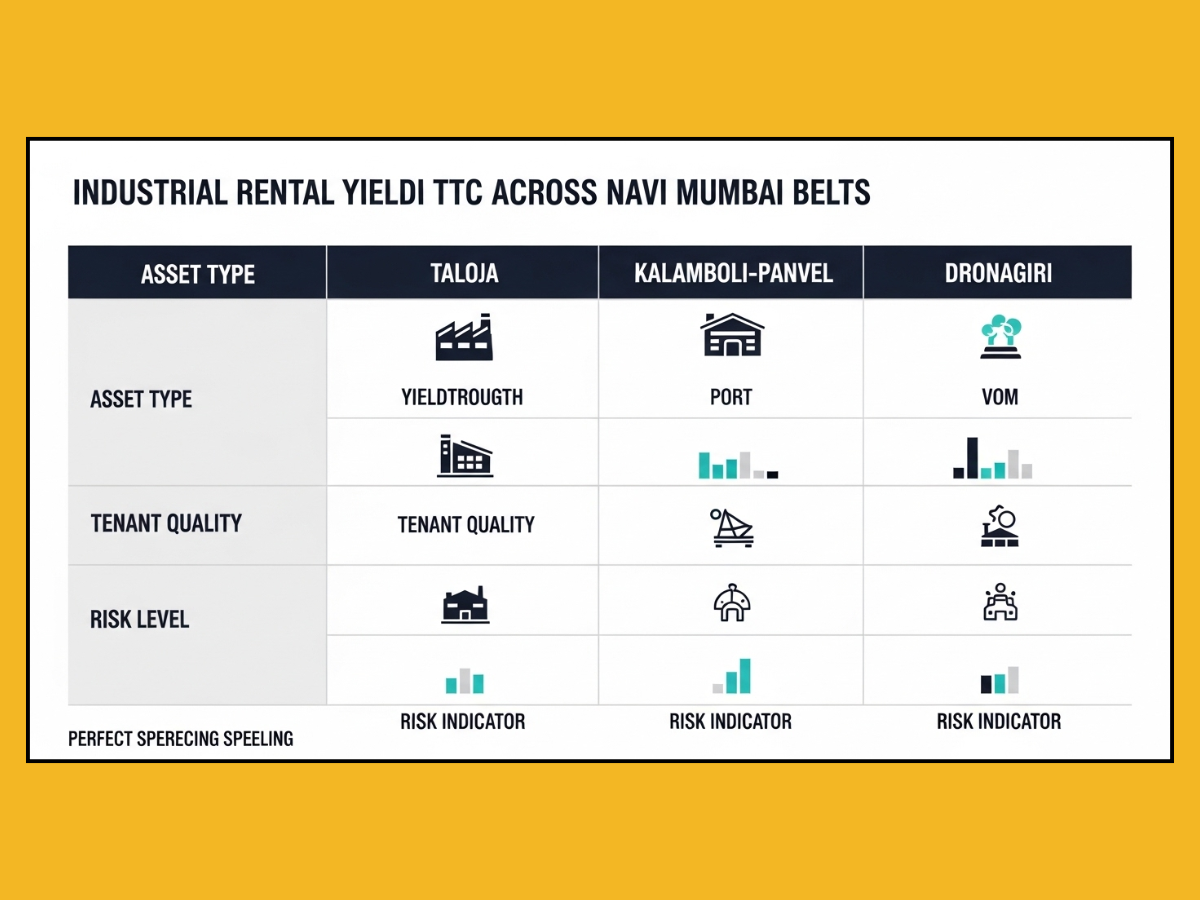
Navi Mumbai industrial rental yield is not one single number, and that is the first thing investors need to understand. TTC, Taloja, Kalamboli-Panvel, and Dronagiri-JNPA side work on different demand engines, different land values, and different risk levels. In simple terms, TTC usually gives safer but more compressed yield, Taloja can look stronger on paper but carries more friction, Kalamboli-Panvel often works well for logistics-led returns, and Dronagiri is a niche port-linked play rather than a universal yield market.
Navi Mumbai industrial rental yield by belt: The Quick answer
| Industrial Belt | Asset Pattern | Gross Yield | Factors (Support/Weaken) | Investor Profile |
|---|---|---|---|---|
| TTC MIDC (Mahape, Rabale, Turbhe) |
Premium RCC, Data Centers, Engineering stock | Moderate | Strong stickiness & low vacancy, but high land costs compress yield | Passive / Wealth Preservation |
| Taloja MIDC | Mfg Sheds, Chemical & Heavy Engineering | Stronger (on paper) | Lower entry price, but compliance risk & water stress can reduce real return | Active Risk-Managers |
| Kalamboli-Panvel | PEB Warehouses, Logistics Parks, 3PL Stock | Mod to Strong | Highway access & Grade A demand support leasing growth | Logistics-focused Buyers |
| Uran-Dronagiri | Port-linked plots, Open storage, EXIM assets | Highly Variable | Port relevance helps, but narrow tenant pool & planning complexity | Supply-chain Specialists |
Why Navi Mumbai industrial yield cannot be read like one market
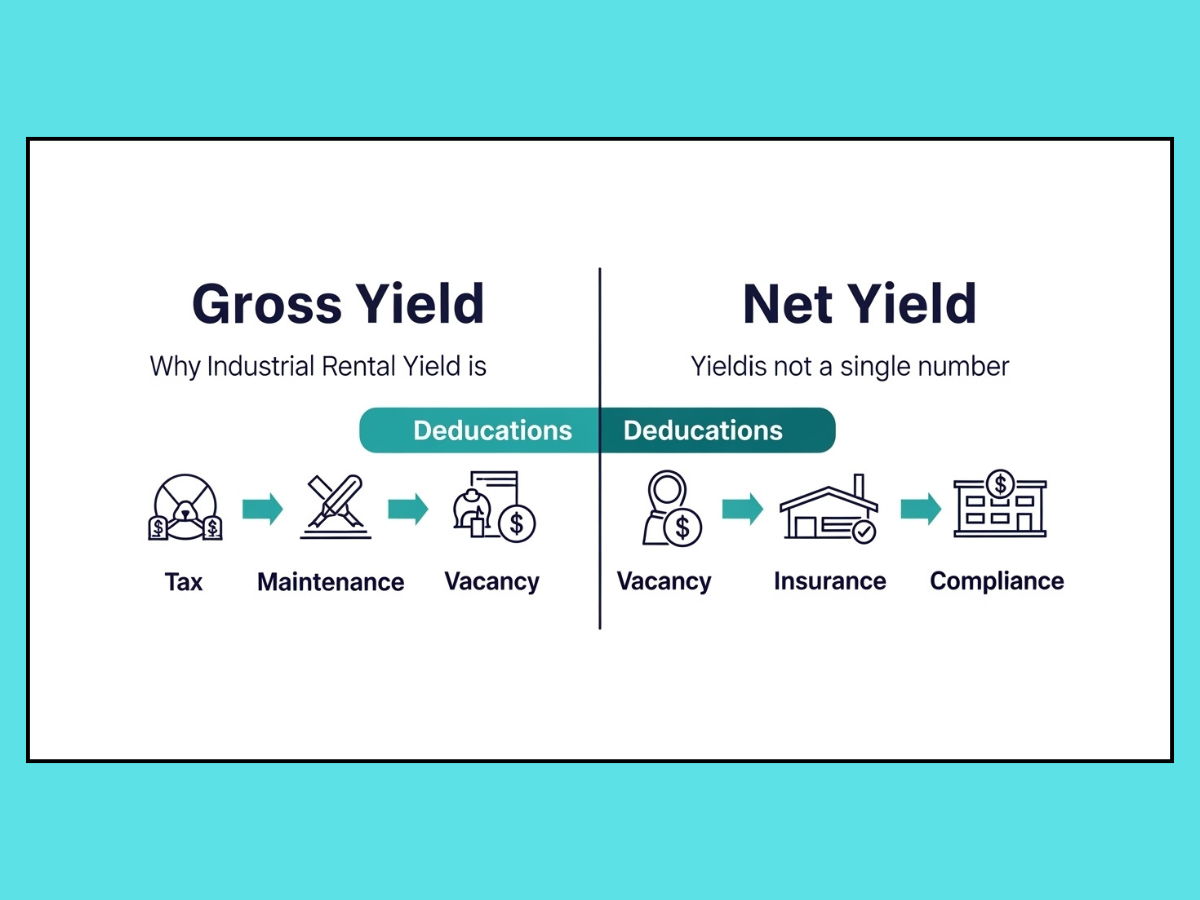
A lot of investors still make the mistake of thinking industrial yield is just rent divided by purchase price. In Navi Mumbai, that is only the starting line. The real answer sits in net yield, not the advertised gross number.
TTC, for example, has very high capital values. That mechanically compresses the percentage yield even when the rent is strong. Taloja has lower entry pricing, so the gross yield often looks better on paper. But if a tenant leaves because of infrastructure problems or compliance difficulty, that higher quoted yield can disappear quickly.
Kalamboli and Panvel operate on a different logic altogether. Their strength is not heavy manufacturing prestige. Their strength is logistics movement, warehousing demand, and route efficiency. Dronagiri again is different. It is tied more directly to JNPA-side port activity and therefore depends on a much narrower tenant profile.
That is why this topic should never be reduced to one neat “Navi Mumbai industrial yield is X%” statement.
Which industrial belts usually sit in which yield zone
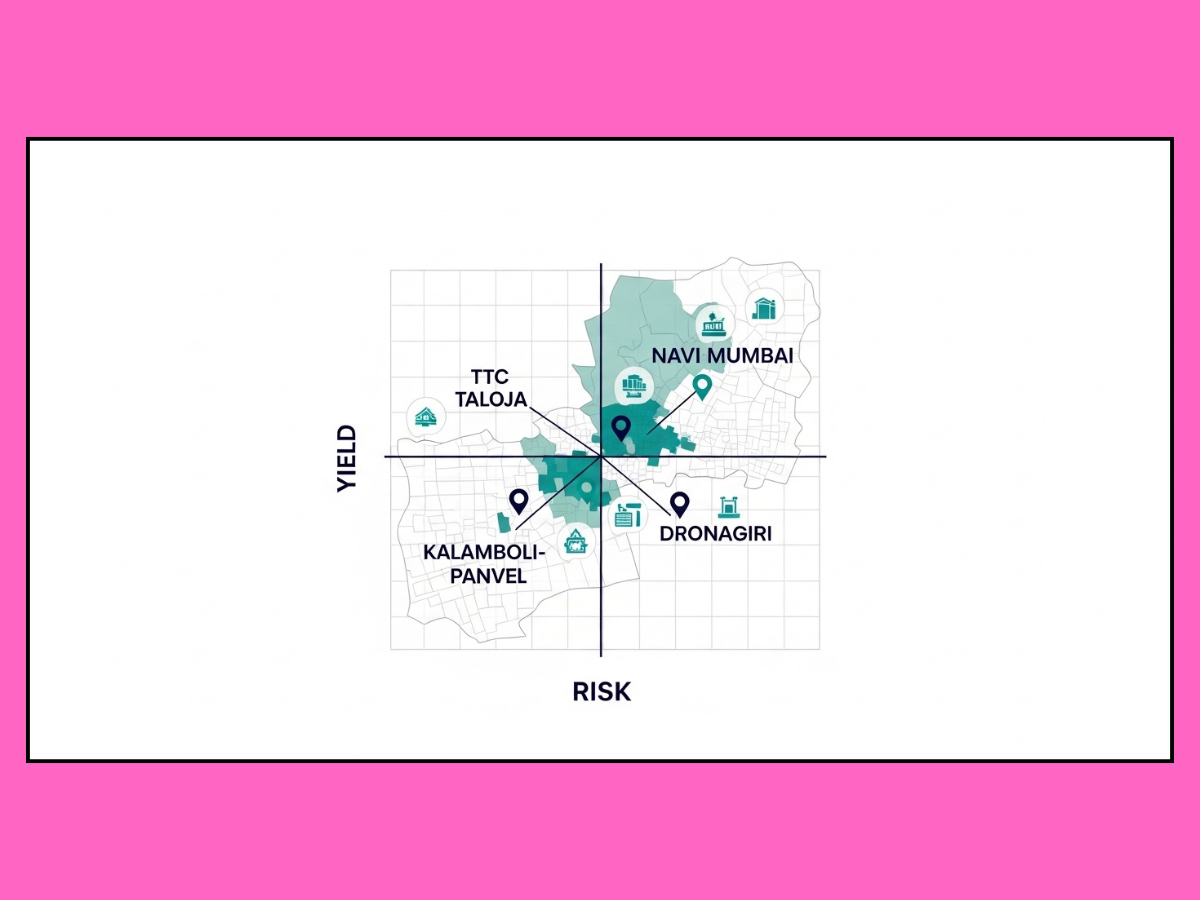
The broad pattern is easier to understand when you stop comparing only percentages and start comparing what kind of income each belt is actually producing.
TTC MIDC usually feels safer even when the yield is not the highest
TTC MIDC is the premium industrial belt in Navi Mumbai. Prime land values there reached around INR 400 million per acre in 2025, while average industrial rentals were around INR 75 per sq ft per month. That sounds strong, and it is. But because the capital entry is so high, the gross yield percentage often looks lower than what you may see in cheaper belts.
Still, many serious investors like TTC because the income is usually more stable. Nodes like Mahape, Rabale, Pawane, and Turbhe attract engineering, manufacturing, technology-linked, and infrastructure-heavy occupiers. These tenants often spend significant money on fit-outs, utilities, or specialized setup. That makes them harder to replace, but it also makes them more likely to stay.
For an investor, this matters more than a flashy projected yield. Lower downtime and stronger tenant quality often beat higher paper yield.
Taloja MIDC can look stronger on paper, but the real answer depends on the exact pocket
Taloja land values were recorded around INR 150 million per acre in 2025, much lower than TTC. Average rentals around INR 35 per sq ft per month can therefore look attractive in yield calculations. This is why many yield-focused buyers get drawn to Taloja first.
But this is where many people get trapped. Taloja’s gross yield can look stronger precisely because entry cost is lower. That does not automatically mean the investment is stronger. Water shortages, truck movement stress, compliance issues for certain unit types, and infrastructure pressure can affect tenant quality, renewal, and operational continuity.
This becomes even more important in pockets where environmental compliance is a real operating factor. Not every Taloja unit faces the same risk, but some businesses do. That is why one Taloja deal can be reasonable while another becomes a yield illusion.
Kalamboli and Panvel-side belts often make more sense for logistics-led returns
Kalamboli and Panvel are not just cheaper alternatives to TTC. They are different products. Their value comes from freight movement, warehousing demand, route logic, and connection to major transport corridors.
The Mumbai warehousing market recorded about 9.6 million sq ft of leasing in H2 2025, with 3PL taking more than 50% of transactions. That matters because Kalamboli-Panvel sits inside this larger warehousing and logistics story. Grade A logistics assets in such corridors are often discussed in the 8% to 12% yield range, which is materially different from standard office or light industrial logic.
This is where investors should think in terms of warehousing economics, not generic industrial branding. A good warehouse on the right road with proper movement logic is a different asset class from an industrial shed sold under the same broad label.
Dronagiri and JNPA side are niche, not universal
Dronagiri, Uran-side, and JNPA-linked areas are not bad markets. But they are not general industrial markets either. They are more niche and far more dependent on port-linked activity, export-import cycles, and specialized occupiers.
Dronagiri property values have shown growth, with average pricing bands roughly between INR 5,230 and INR 8,587 per sq ft and a five-year growth trend around 24.3%. But that does not mean every parcel there is a superior rental-yield story. Leasing demand is far more selective.
This belt makes sense only when the tenant logic truly matches the port-side location. Otherwise, the niche nature of the market can increase leasing risk.
Why gross yield is the most misleading number in many industrial deals
This is where many industrial investors in Navi Mumbai make their biggest mistake. They see a monthly rent, divide it by purchase price, annualize it, and feel satisfied. That is gross yield. It is not useless, but it is incomplete.
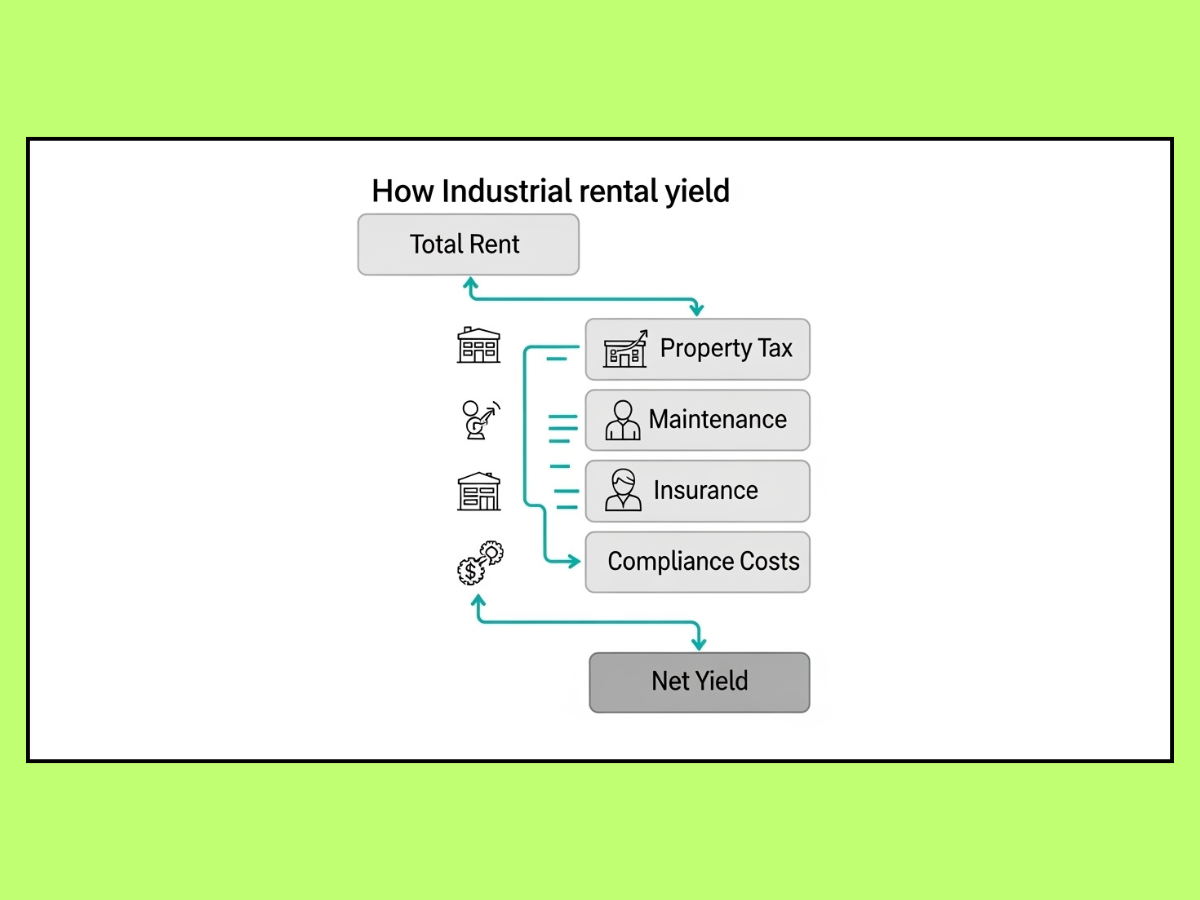
Net yield is what matters. That is the return left after the real costs of owning and leasing the asset are deducted.
These costs can include:
- property tax
- subletting charges where applicable
- insurance
- maintenance
- fit-out recovery or structural repairs
- vacancy period between tenants
- transfer-related friction in leasehold structures
In Navi Mumbai, these are not small footnotes. They can materially change the investment story.
A simple gross vs net yield reality check
Let us say an industrial asset is leased at INR 1,00,000 per month. That gives gross rent of INR 12,00,000 per year. On paper, the yield may look decent.
But now start reducing it:
- municipal property tax liability
- MIDC subletting cost, where relevant
- industrial insurance
- structural maintenance and wear-and-tear
- downtime between occupiers
- legal or authority documentation cost
Suddenly, the actual realized return can fall sharply below the quoted headline number. This is why advertised high industrial yield should never be accepted without a cost-stack check.
TTC vs Taloja: the belt comparison that most investors oversimplify
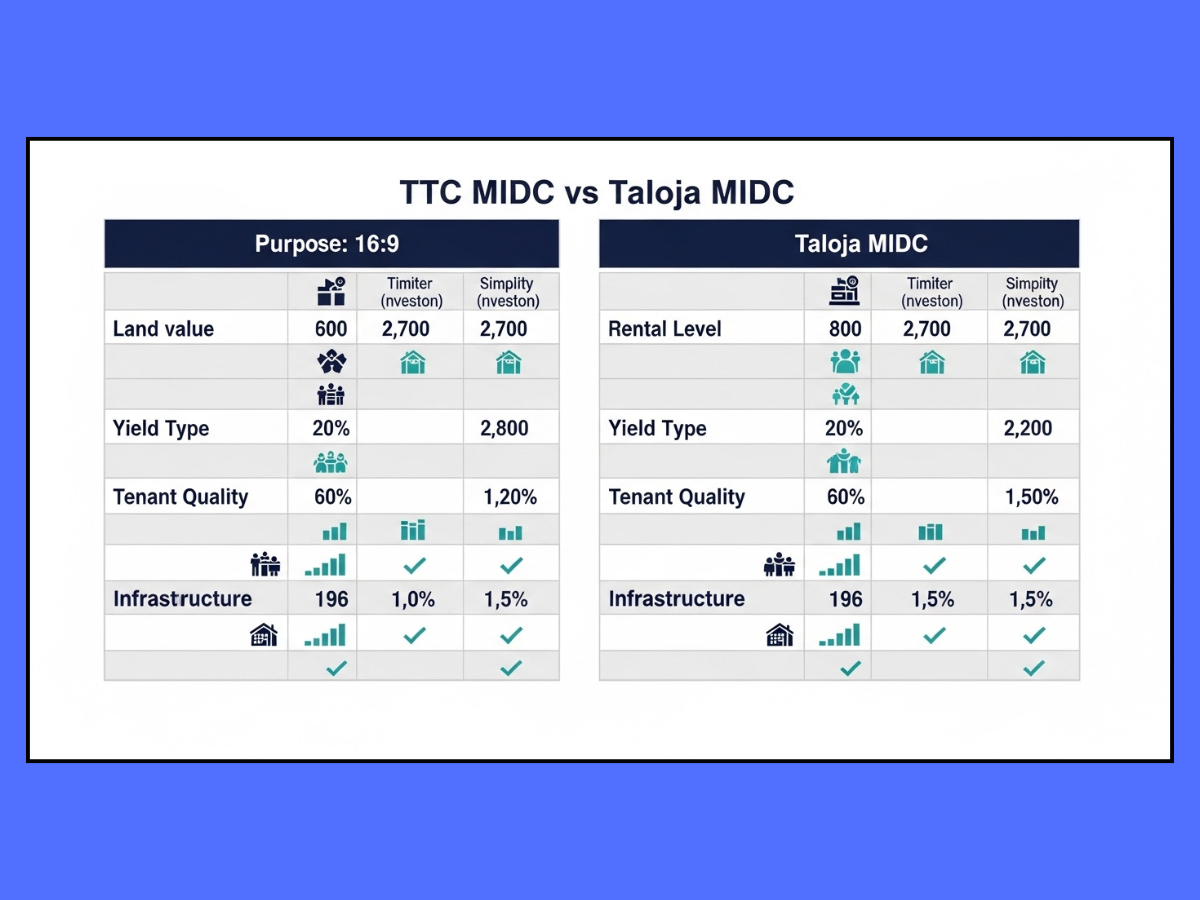
| Comparison Factor | TTC MIDC | Taloja MIDC |
|---|---|---|
| Land Value (2025) | ~ ₹400M per acre (Prime) | ~ ₹150M per acre |
| Rental Level (Avg) | ~ ₹75 psf / month | ~ ₹35 psf / month |
| Yield Appearance | Compressed | Stronger (on paper) |
| Tenant Quality | Stronger & Stickier | Variable by pocket |
| Infrastructure | More Mature | Operational Friction |
| Best Investor Fit | Stability-first | Yield-aggressive |
When Kalamboli-Panvel-side industrial assets make more sense than TTC or Taloja
For warehousing and transport-heavy users, Kalamboli and Panvel-side belts can make more sense than both TTC and Taloja. Not because they are always cheaper. Because the operating logic is different.
These belts benefit from strong road connectivity and freight movement relevance. For 3PL companies, FMCG distribution, regional storage, and fast-movement warehousing, that matters far more than sitting in a famous industrial belt.
This is also where asset type changes the yield answer.
PEB vs RCC changes the economics inside the same belt
A warehouse investor should not compare only belt against belt. The structure format matters. Pre-Engineered Buildings and RCC behave differently from a return perspective.
PEB structures were estimated in the dossier at roughly INR 1,400 to 2,600 per sq ft with an 8 to 12 month delivery timeline. RCC was estimated at around INR 1,800 to 3,200 per sq ft with an 18 to 24 month timeline.
That faster PEB delivery can mean earlier leasing and earlier revenue. For a warehouse-led strategy, time-to-income is a major part of the return story.
So even inside the same Kalamboli or Panvel corridor, one asset can outperform another simply because it reaches revenue faster and suits logistics users better.
MIDC, CIDCO and municipal friction: why yield in Navi Mumbai cannot be read without authority context
One of the biggest problems in industrial property analysis is that people discuss belt names without discussing authority structure. In Navi Mumbai, that is a serious mistake.
MIDC, CIDCO, and local municipal bodies each affect the deal differently. Documentation, transfer process, permissions, subletting logic, and tax burden can all change depending on who controls what.
CIDCO transfer fee escalation changed the liquidity math
From April 2025, CIDCO increased transfer fees significantly, with hikes going up to 50% in certain cases. Large commercial and industrial property transfers were especially affected. That matters because leasehold transfer friction is not just a paperwork issue. It directly changes entry cost, exit cost, and effective investment return.
This is especially important for short-hold investors. If the exit carries a high transfer burden, the real capital gain gets hit.
NMMC and PCMC tax realities cannot be treated lightly
NMMC applies a very heavy tax framework to commercial and industrial property, around 68.33% to 68.45% on the rateable value according to the dossier. That does not mean 68% of the market rent goes away directly in a simplistic sense, because the tax base calculation itself follows municipal rules. But it does mean the property-tax load is serious and must be modeled properly.
The Supreme Court also upheld NMMC’s authority to recover property tax from TTC MIDC units after a long legal battle. That means tax arrears and past liability checks are not optional due diligence items. They are central to yield analysis.
The same principle applies in Panvel-side jurisdictions too. Local tax friction can materially affect net return.
What to verify before trusting rental yield in any Navi Mumbai industrial belt
The exact plot, sanctioned use, unit type, and access conditions matter more than the broker’s area label. That line deserves repetition because it is the safest summary of this whole topic.
Before trusting any advertised industrial yield, verify these points:
- whether the asset is leasehold and under which authority
- whether transfer premium, NOC, or subletting rules apply
- whether there are municipal tax arrears
- whether the tenant’s exact activity is permitted in that location
- whether the sanctioned power and water match the intended user
- whether truck access, turning, loading and road width are actually workable
- whether the quoted rent is real transacted rent or just asking rent
- whether the property is vacant, pre-leased, or dependent on future leasing assumptions
- whether the structure is PEB, RCC, older shed stock, or something adapted from another use
- whether the belt’s headline reputation is hiding pocket-level weakness
This is where serious investors create an edge. Not by chasing the highest number, but by rejecting misleading numbers.
Which belt usually fits which investor type
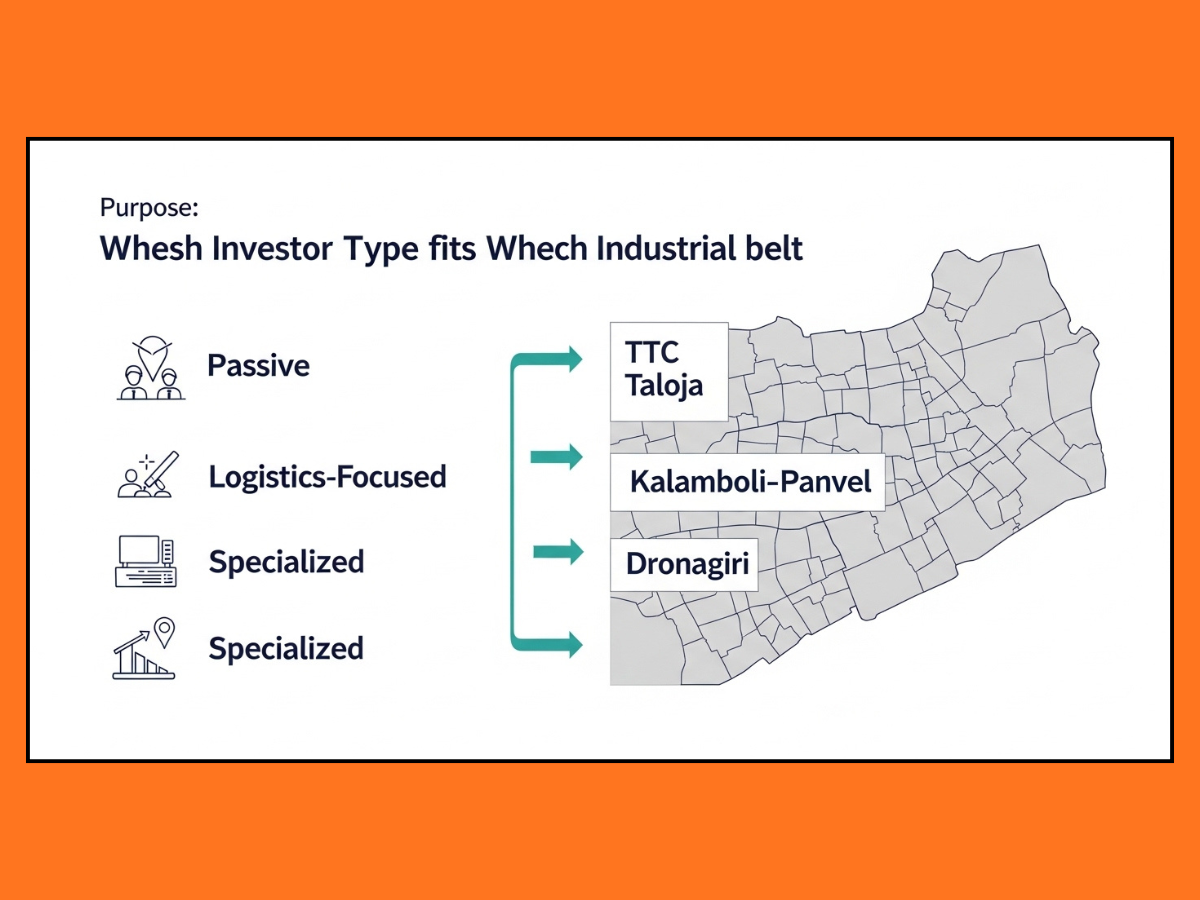
Different investors should not be hunting in the same belt for the same reason. That is another major source of confusion.
Passive income and wealth-preservation investors
These investors usually fit better in TTC MIDC or stronger pre-leased logistics assets in the Panvel corridor. The priority here is stable rental flow, stronger occupier quality, and lower vacancy.
They may accept a more compressed gross yield because peace of mind has value.
Aggressive yield seekers and active managers
This profile is usually more suited to Taloja. But only when the investor understands the operational realities and has the ability to manage them.
A lower-cost acquisition with stronger gross yield potential can work, but only if downtime, compliance friction, and infrastructure problems are properly handled.
Logistics-focused investors
Kalamboli and Panvel-side assets are often the more natural fit here. The logic is route-driven and demand-driven. If the investor understands warehouse demand, tenant fit, and construction timing, this corridor can offer a strong risk-adjusted case.
Specialized export and supply-chain operators
Dronagiri and JNPA side make more sense for this profile than for general investors. This is not a universal rental-yield market. It is a niche strategic market.
Common mistakes people make while comparing industrial rental yield by belt
Some mistakes keep repeating in Navi Mumbai industrial deals.
Mistake 1: Choosing Taloja only because the entry price is lower
Lower capital value can improve gross yield. But if tenant replacement takes too long or the pocket has operational friction, the real return falls.
Mistake 2: Assuming TTC is “too expensive” and therefore a weak investment
TTC can still make sense for investors who value tenant quality, renewal strength, and lower vacancy. Lower risk is also a form of return.
Mistake 3: Treating all Panvel-side stock as Grade A logistics stock
That is not true. Good warehousing yield depends on actual road logic, structure quality, loading practicality, and tenant suitability. Area name alone is not enough.
Mistake 4: Treating Dronagiri as a broad-based industrial income market
It is more specialized and more selective. Port relevance helps only when the occupier need is truly port-linked.
Mistake 5: Ignoring tax and transfer friction
This is one of the most damaging mistakes. Gross yield without tax, transfer, and authority cost is a half-finished calculation.
Mistake 6: Using government guidance value as proof of actual rental performance
Ready Reckoner and related government valuation references are useful as statutory benchmarks, not as direct proof of true market rent or leasing velocity.
Conclusion
The right way to read Navi Mumbai industrial rental yield is not to ask, “Which belt gives the highest percentage?” The right question is, “Which belt gives the most believable return after real-world friction?”
TTC is usually the safer, stability-first belt with compressed yield. Taloja can be more yield-aggressive, but only when the exact property and risk profile are right. Kalamboli-Panvel often stands out for warehousing and logistics-led returns, especially when the asset is built and positioned correctly. Dronagiri is a niche port-linked play, not a blanket recommendation.
For most serious investors, the winning move is not chasing the highest quoted number. It is identifying the belt where tenant demand, authority structure, access logic, and cost burden all align. In Navi Mumbai industrial property, that is what separates a good-looking deal from a genuinely durable one.